Gantt charts can be helpful for students.
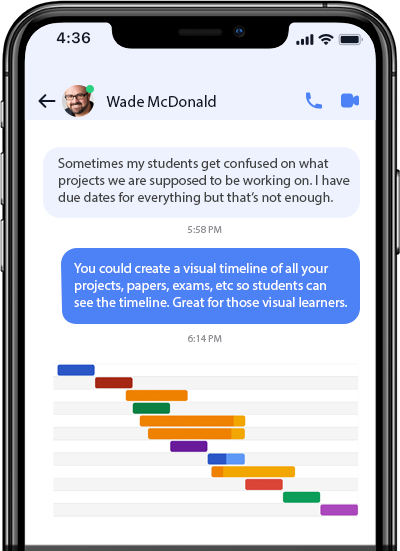
Businesses often use Gantt charts for project management, but I also use them in my classroom. A Gantt chart gives the students a higher-level view of the semester for your course. It shows the start and end dates and the overlap of projects.
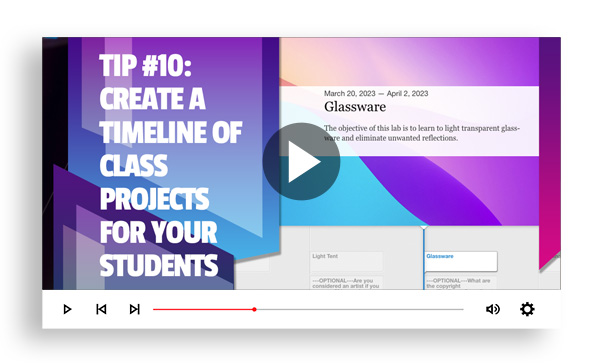
I used H5P to create my chart for my course. I’ve embedded the chart in my welcome page and content pages throughout the semester. I aim to continually communicate with students about past, current, and future projects. If dates need to be changed, I can quickly change them on the backend of H5P, and all your instances of that chart will automatically update.
Using H5P is one way to create a Gantt chart or timeline, but a quick Google search found dozens of other ways to create exciting and valuable charts, including Google charts and Microsft Excel.


